Andes Views
Role: Lead UI/UX Designer
Year: 2023 – 2024
Company: Amazon – Business Data Technologies (BDT) organization
Technology: Figma
The problem
The Business Data Technologies (BDT) organization manages Amazon’s petabytes of data in a data lake called Andes and provides tools that enable Amazonians to publish and consume that data. Due to federal regulations, BDT needed to improve how customer data is protected by introducing fine-grained access controls. Rather than granting users access to an entire dataset, these controls allow access to be restricted to specific rows and columns based on the user’s permissions. To support this effort, the team needed to design Andes Views end to end on an accelerated timeline, with a P0 delivery deadline of March 31 and only 2–3 weeks available for the design process.
What’s a view?
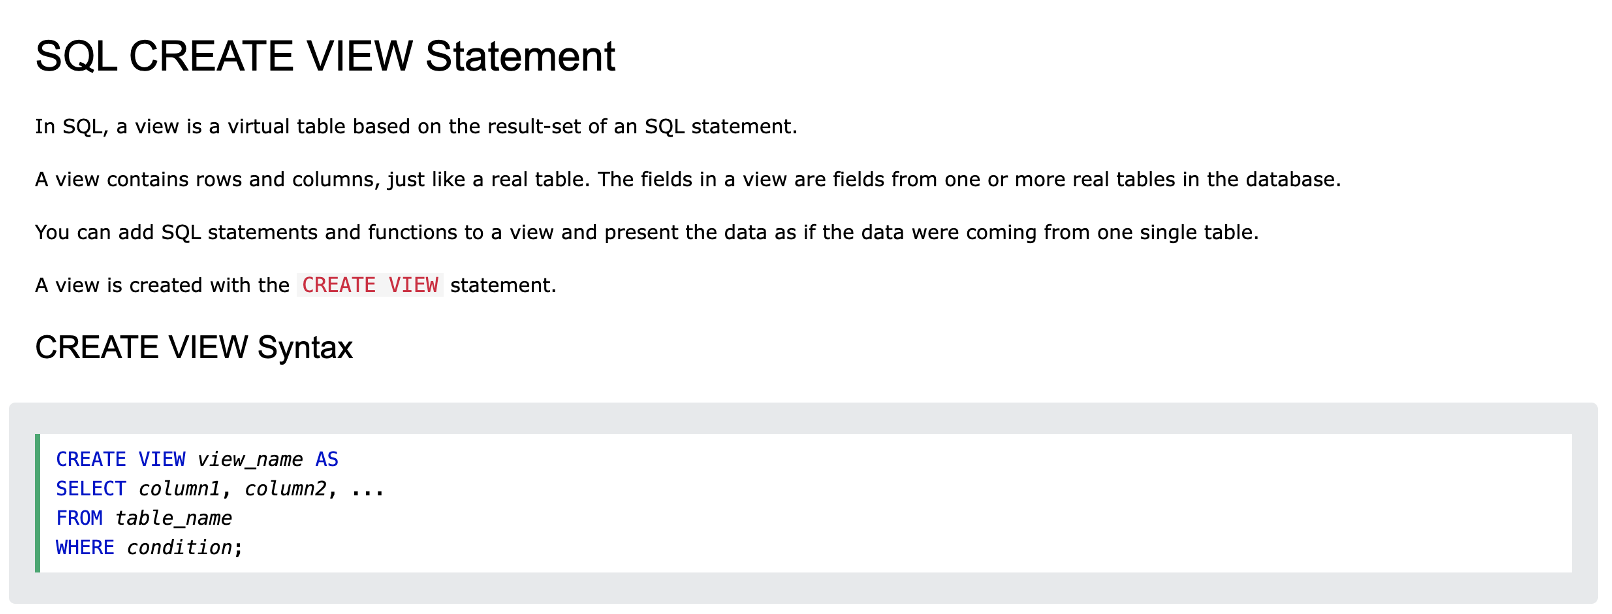
A SQL view is like a virtual table that you can create from an existing table or other views in a database. It’s a saved SQL query that you can use as a table to perform various operations such as selecting, filtering, and joining data. A SQL view doesn’t store data itself, but instead acts as a pointer to the underlying data source. This means that any changes you make to the data in the underlying tables will automatically be reflected in the view. Think of it like a shortcut to a specific set of data that you can use instead of writing the same query over and over again.
The process
Within a short 3 week timeframe, I iterated on multiple rounds of phase 0 (P0) and long-term vision mockups to drive collaboration and alignment across several cross-functional teams. I defined and prioritized UX instrumentation metrics to enable measurement of user behavior to set a baseline for future improvements. I demoed the Andes Views designs to the BDT User Advisory Board (UAB) for user feedback and presented to BDT leadership for signoff.
Post-P0 release, I conducted Andes Views P0 user interviews to collect user feedback and drive the Andes Views feature roadmap. I created a research plan, conducted 5 user interviews, performed analysis on the raw data, and wrote a findings report with 8 insights and 13 proposed enhancement user stories that was presented to the Andes Views team. Top insights include 1) Users would like support for more complex SQL, such as joining multiple source datasets. 2) Users would like enhancements to the SQL query editor. 3) There are opportunities for better integration of Andes Views with other areas of DataCentral. As a result, BDT prioritized building JOIN functionality as part of the Andes Views P1 design in 2024.
After the Andes Views General Availability (GA) launch, I conducted a survey with Andes Views users for feedback on the feature and and wrote a findings report highlighting top insights an features users want to see, including: 1) The majority of participants are satisfied with Andes Views 2) Users want support for JOINs across multiple Andes datasets 3) Users want consumer-owned views 4) Users want streamlined permissions 5) Users want automated version upgrades and inline updates 6) Users want UI improvements 7) Users want improved query functionality. Based on the research findings, along with support for JOINs in 2024, the team also pursued consumer-owned views, streamlined permissions, and automated version upgrades.
Mockups
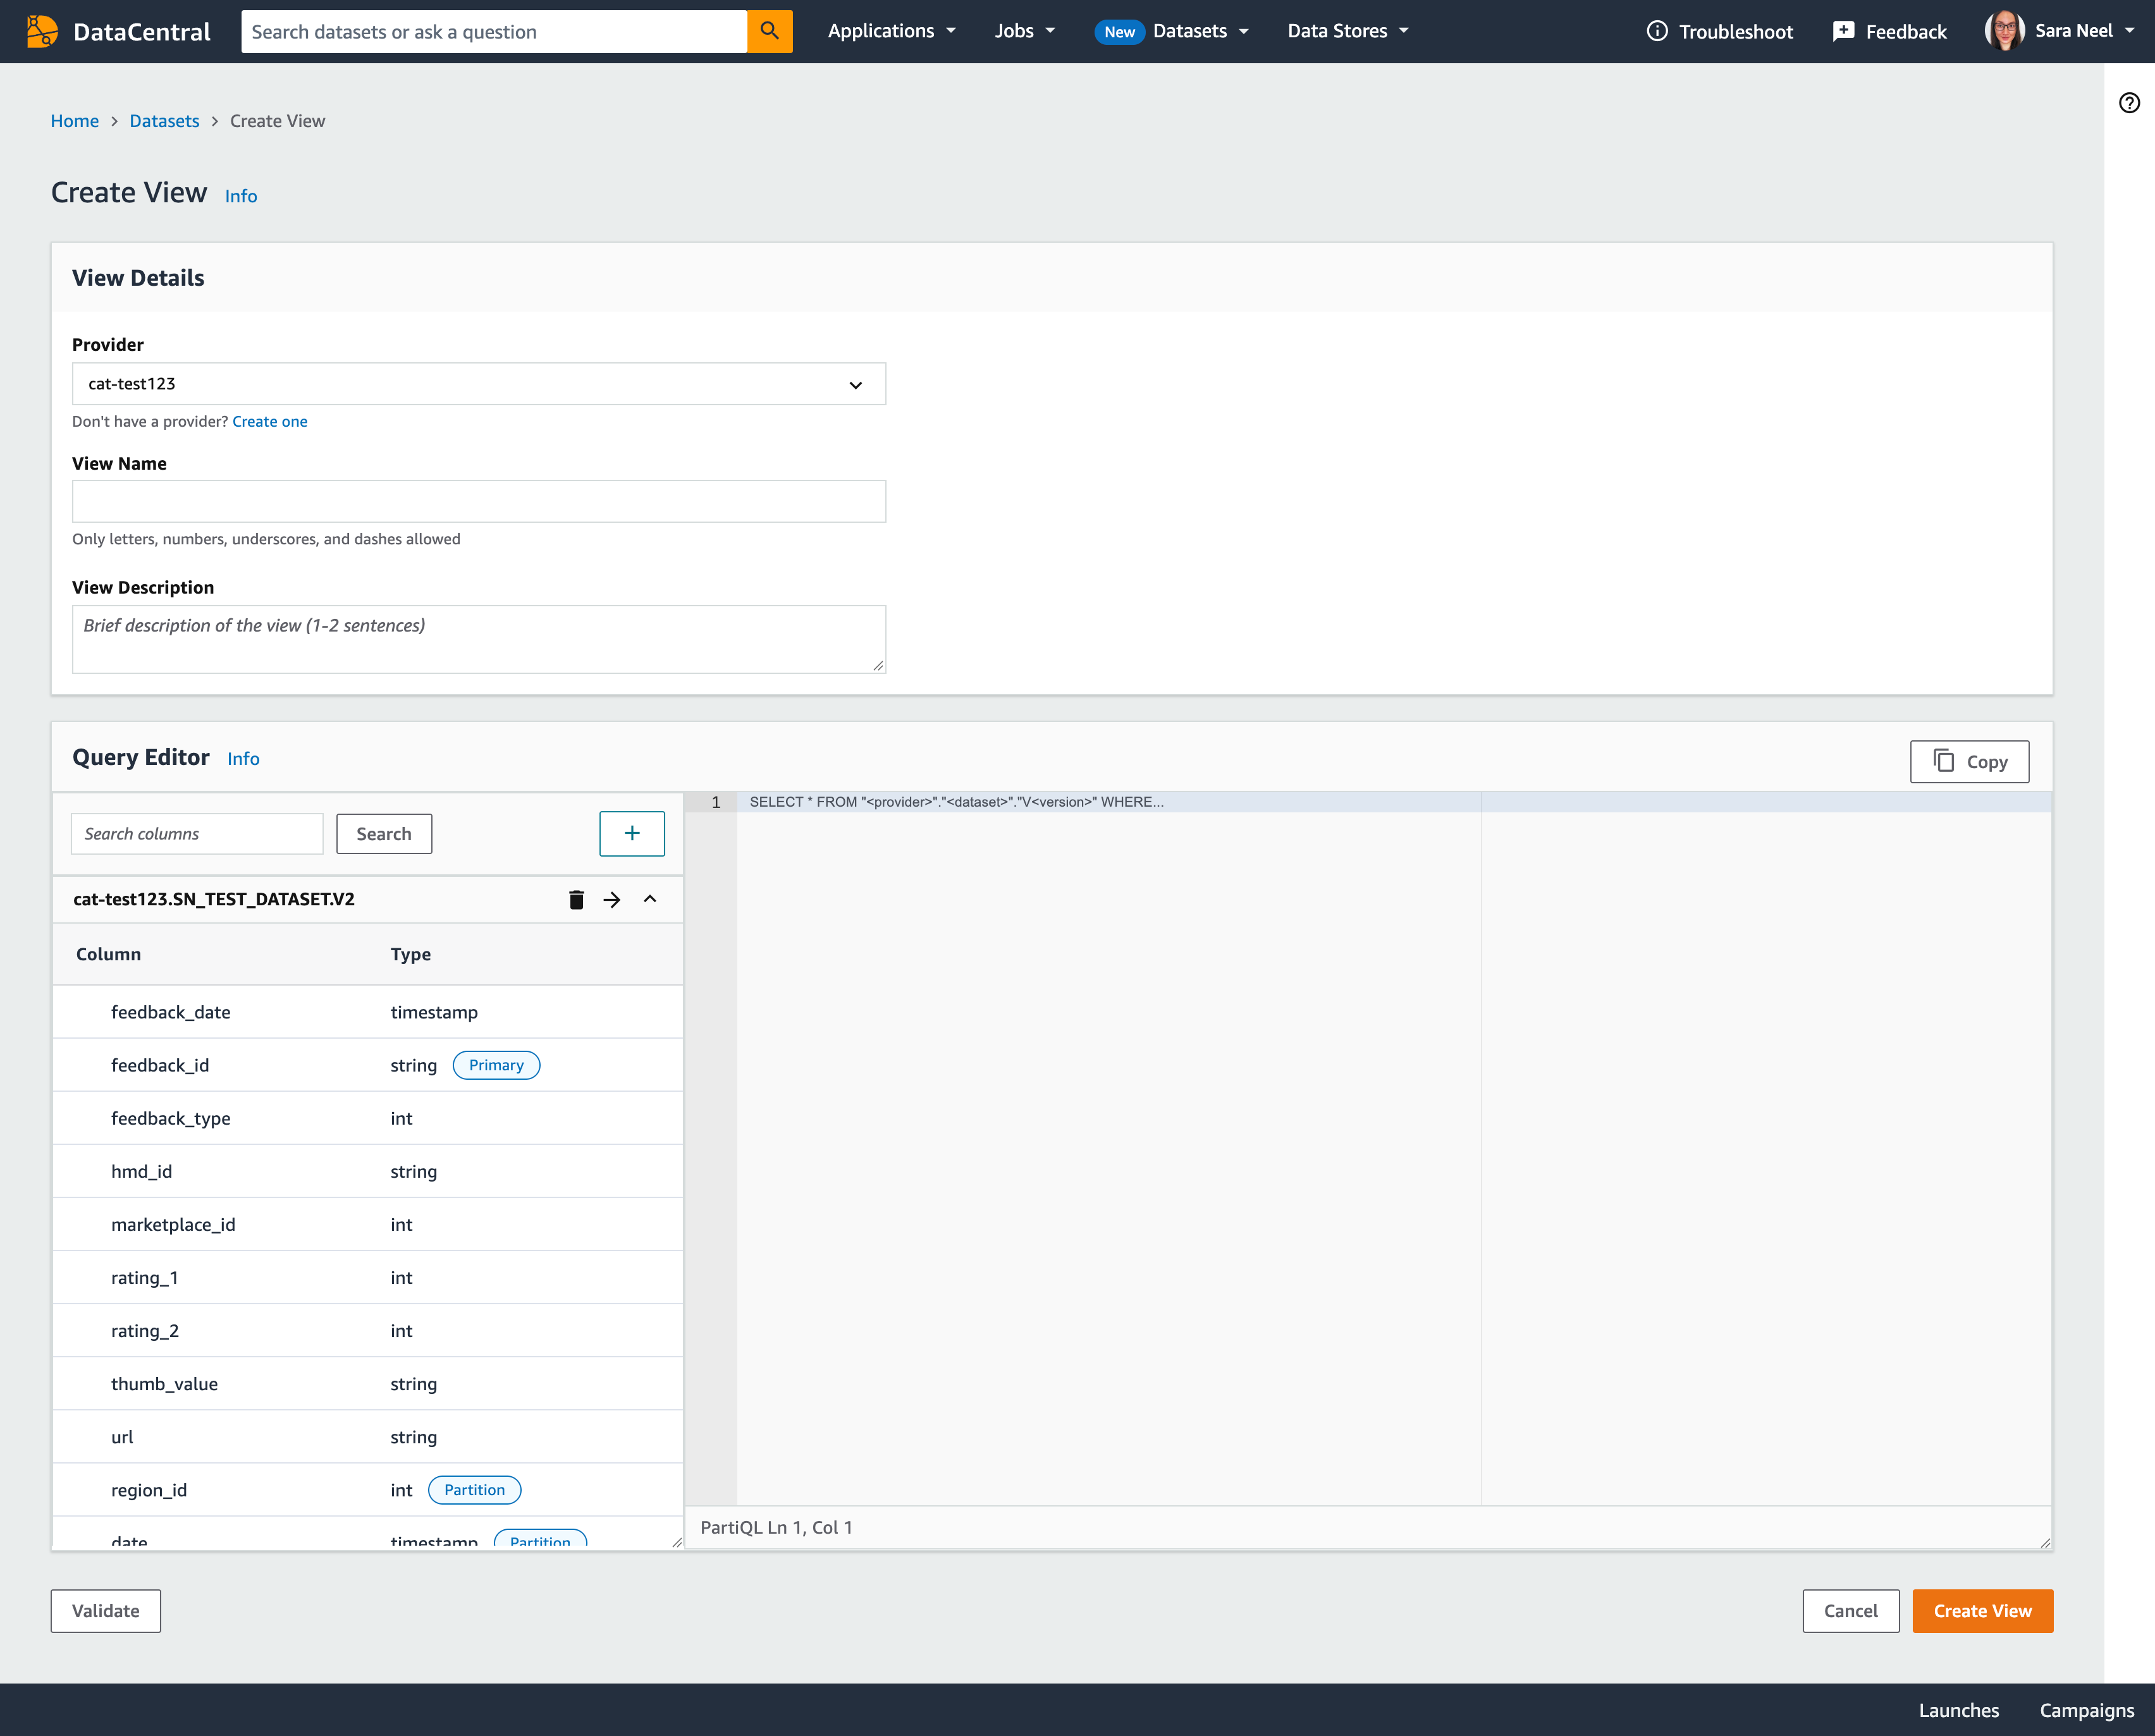
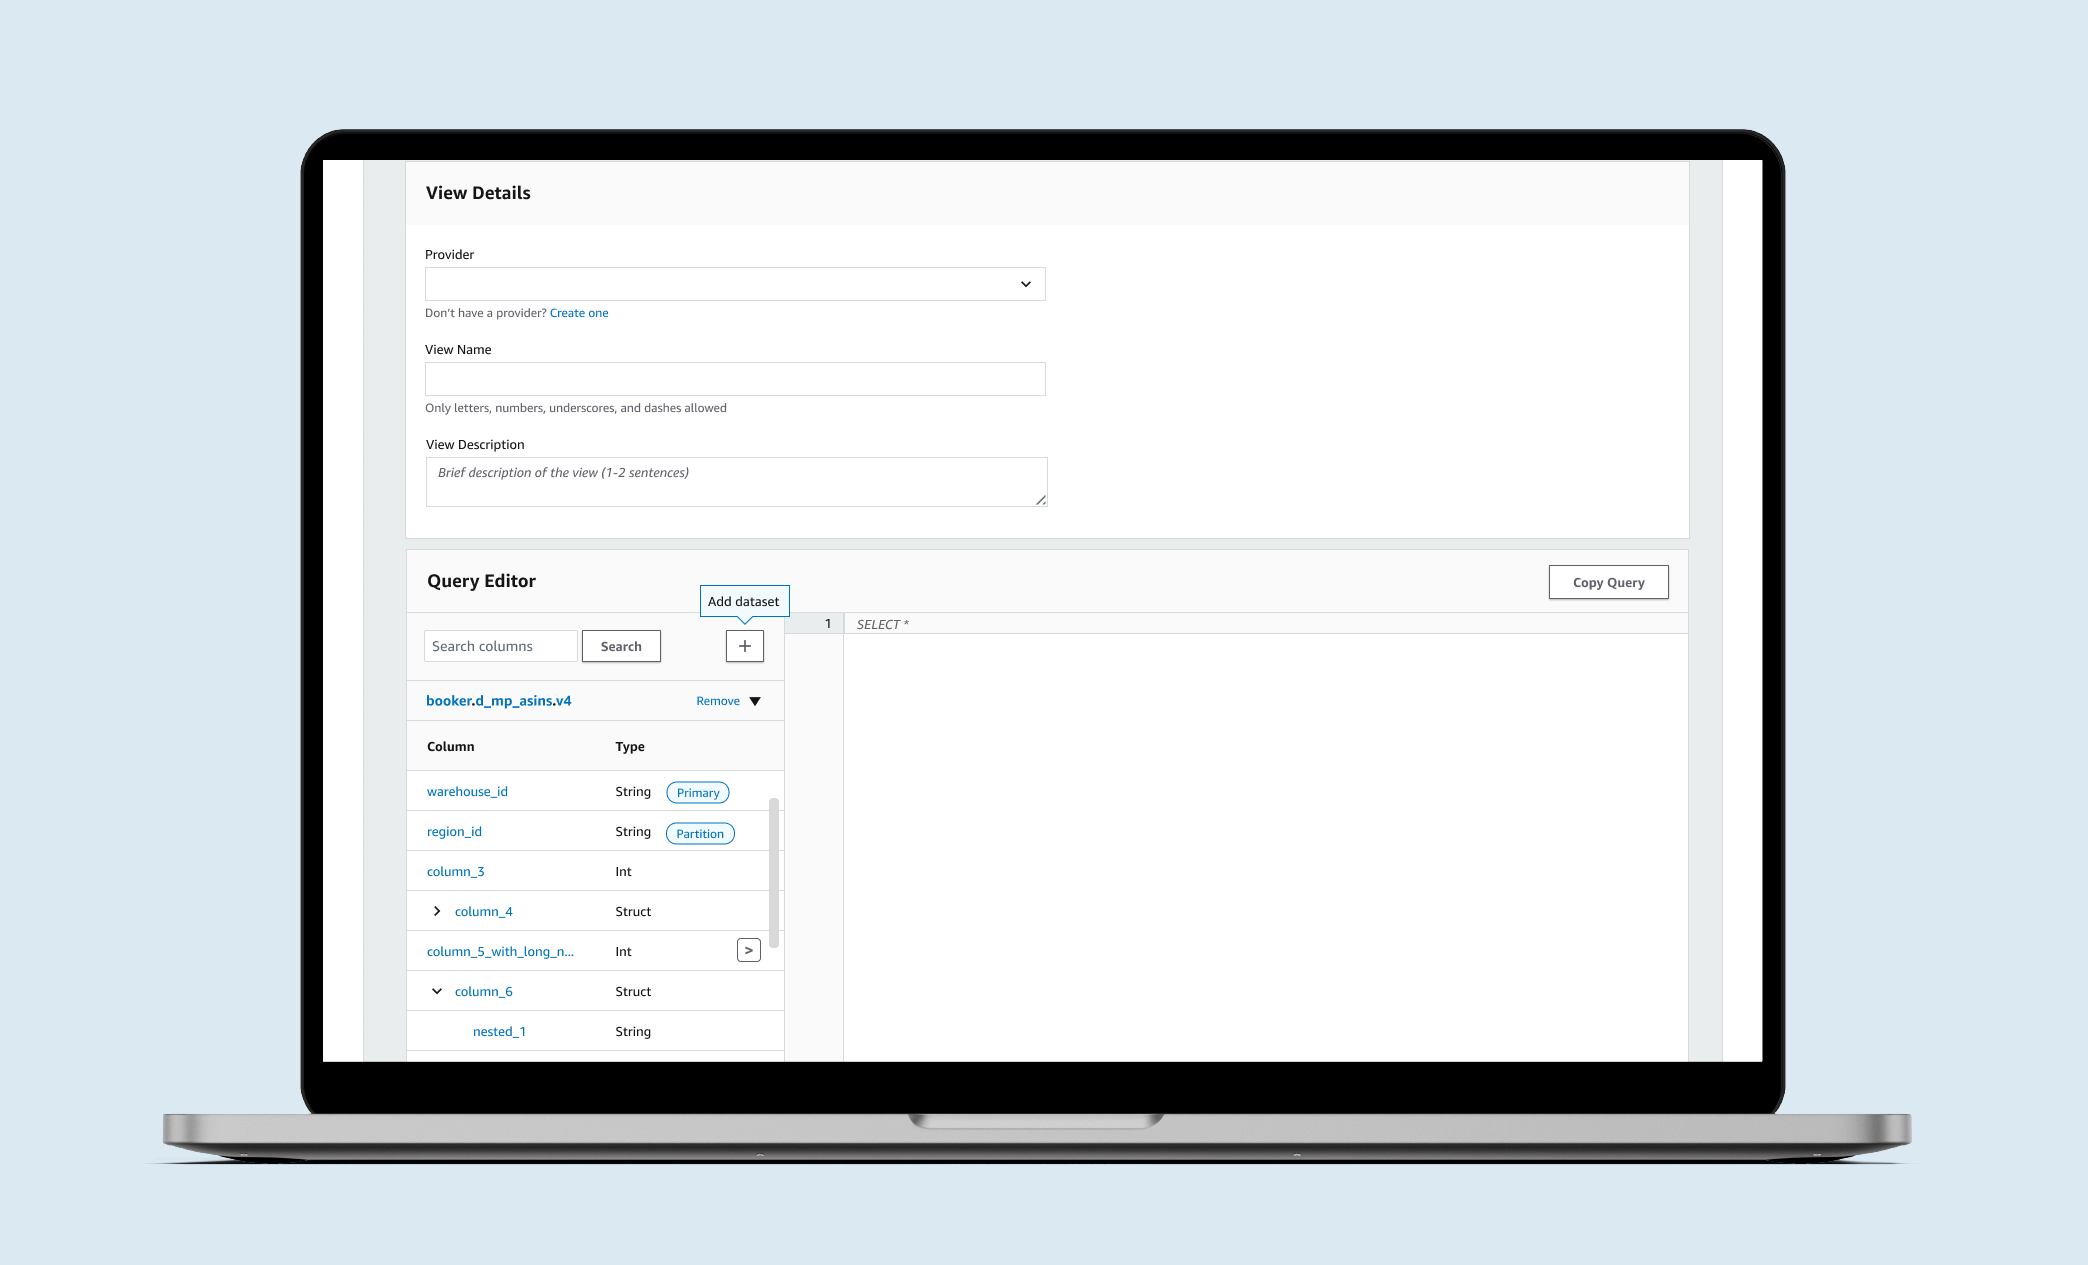
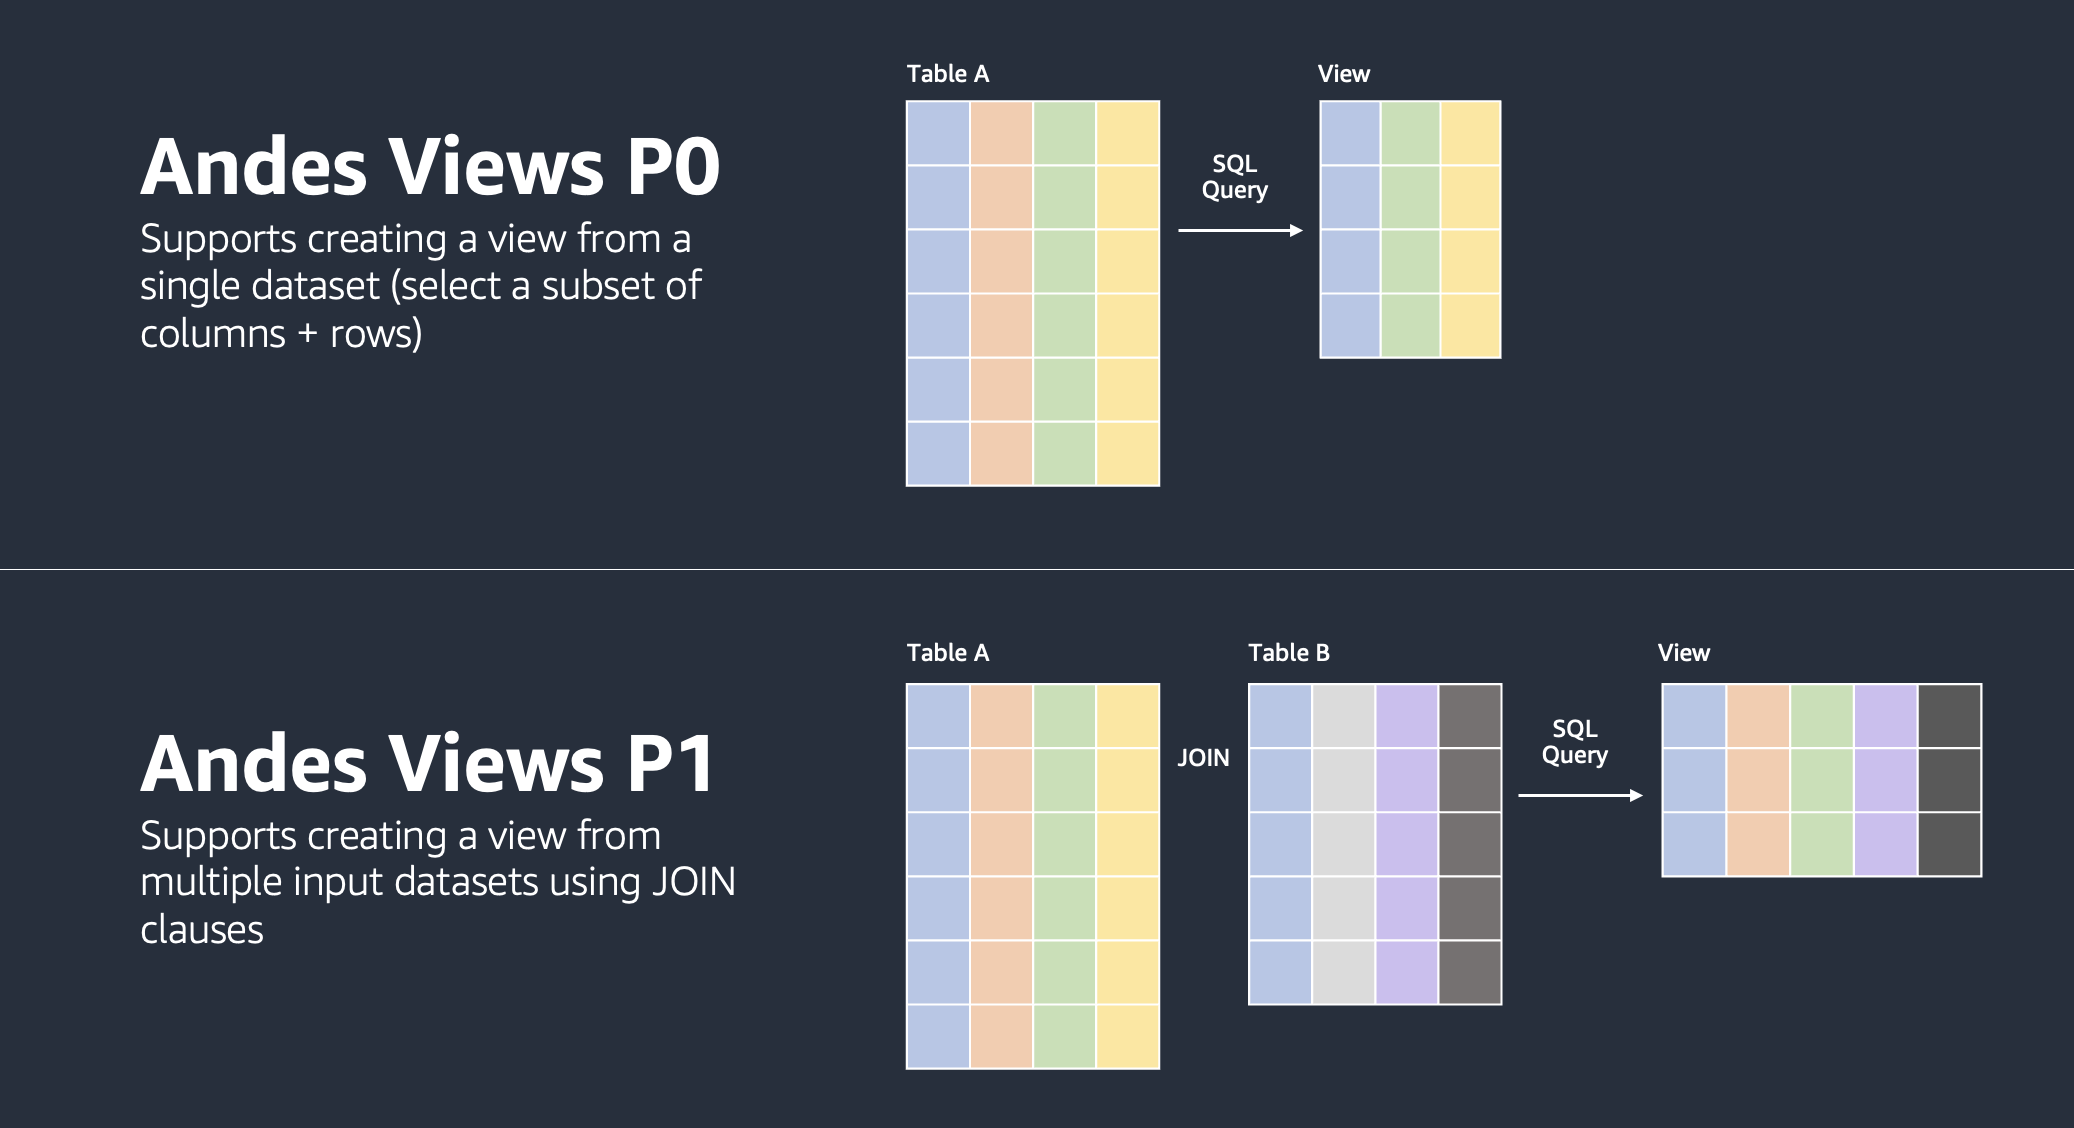
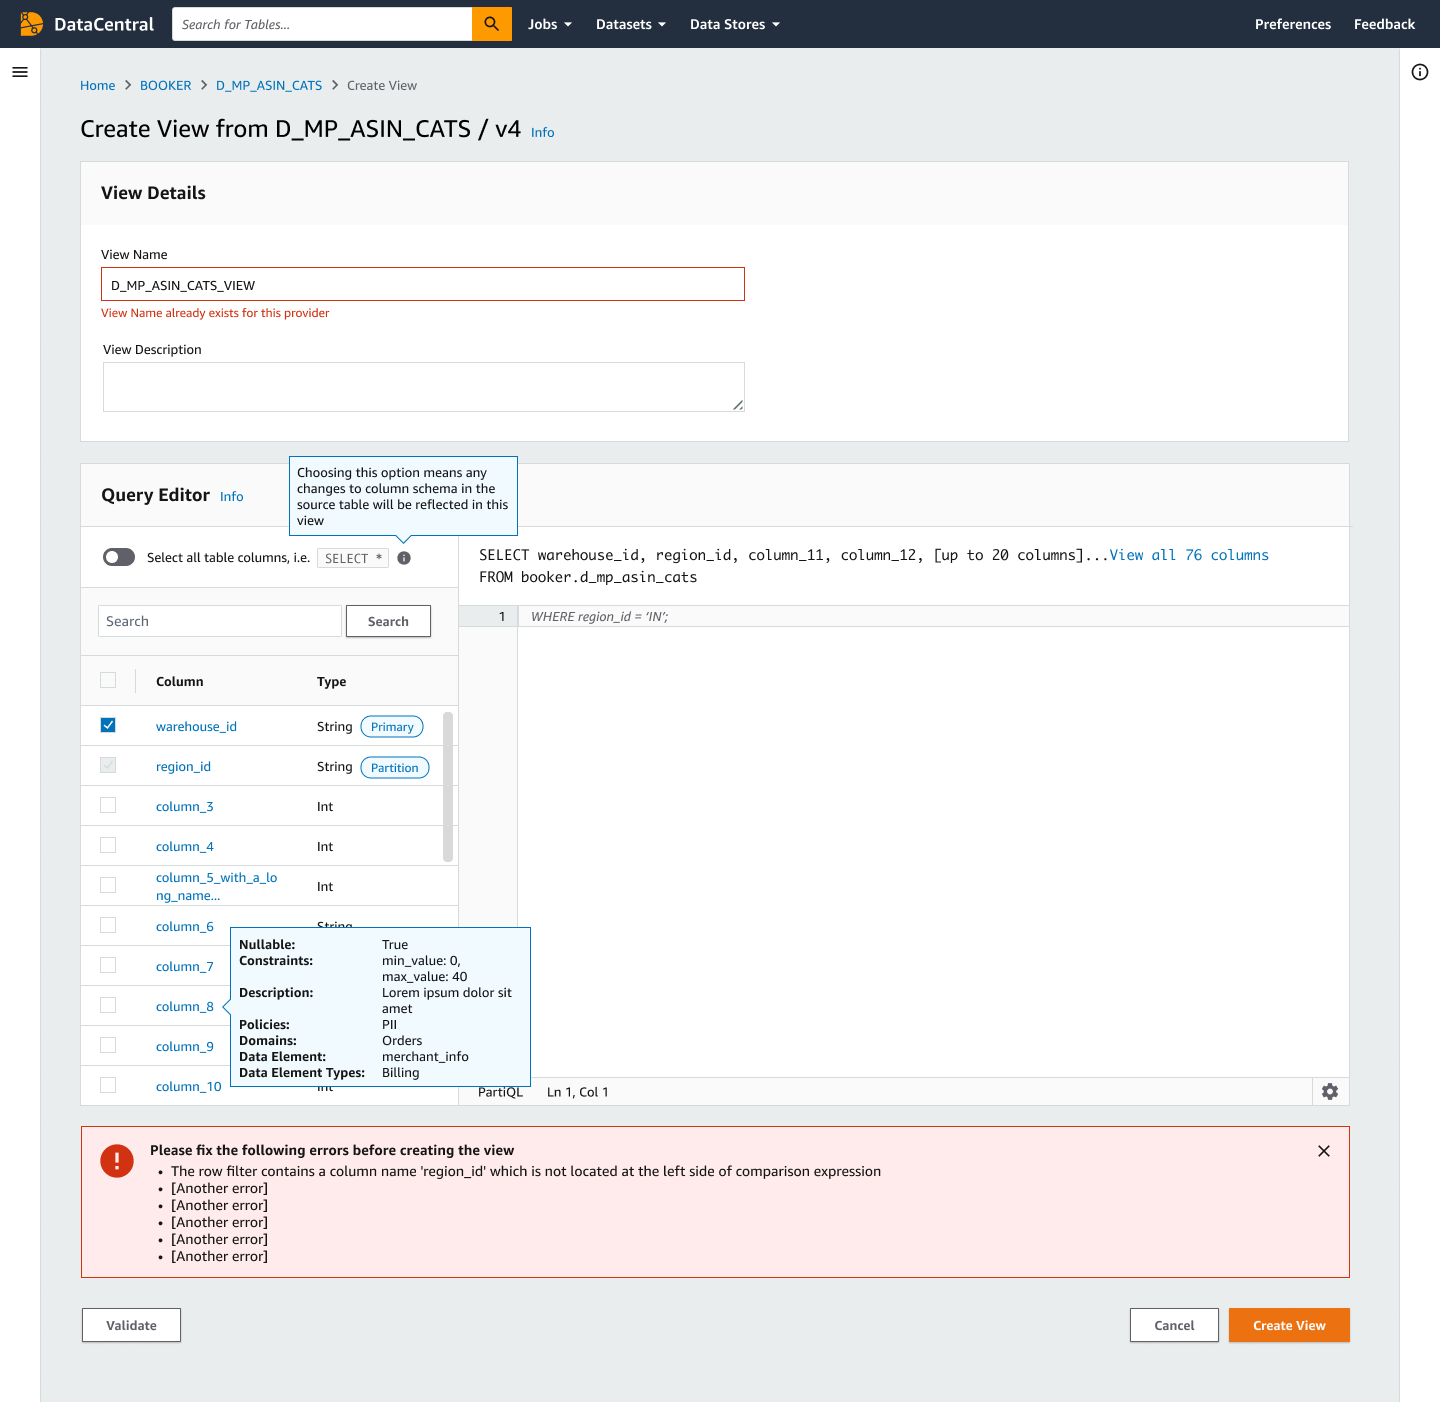
Andes Views P0 (2023) allows users to create a view from a single source dataset, so that the resulting view contains a subset of columns and rows from the source dataset.
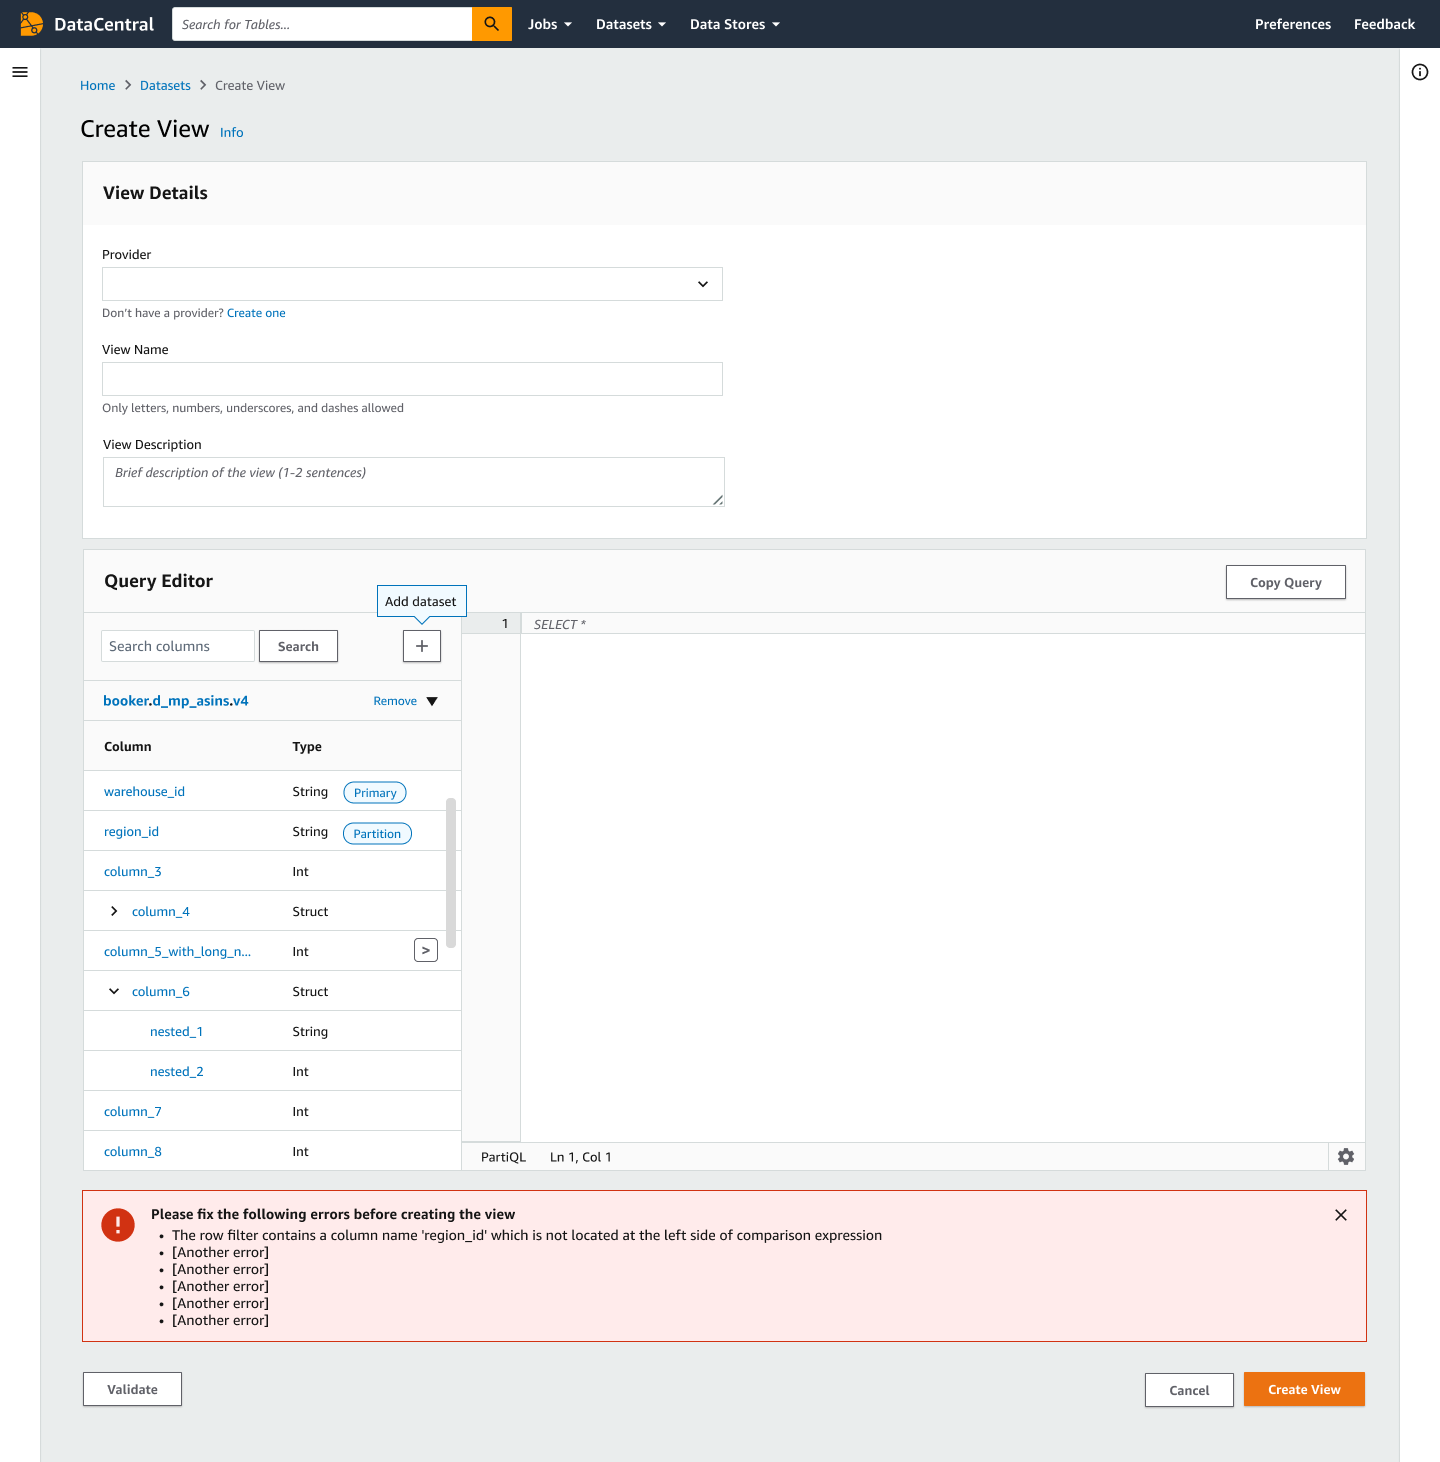
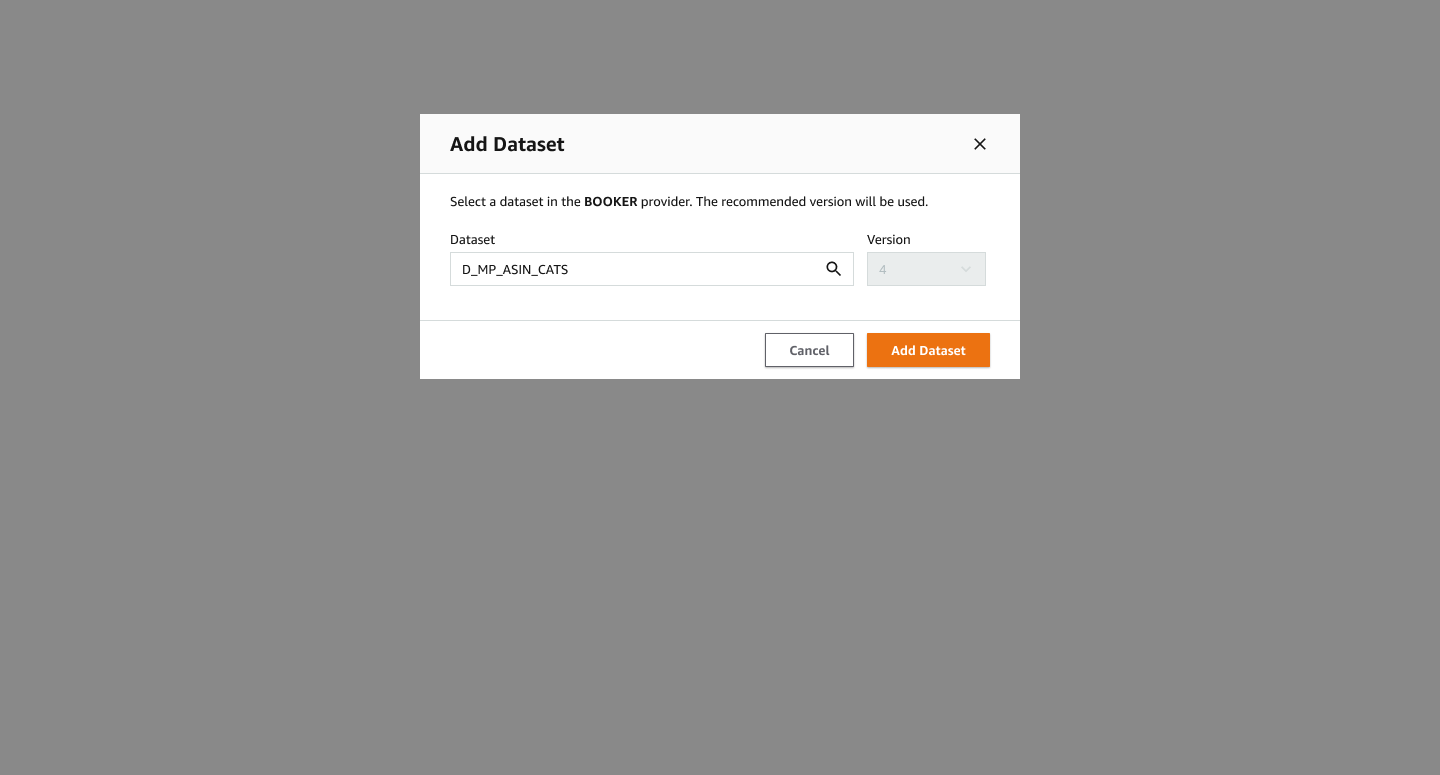
Andes Views P1 (2024) allows users to create a view from multiple source datasets via JOIN statements. Users can add one or more datasets and create a view by joining columns and rows across multiple datasets.
The result
Despite the delay in UX engagement and very quick timeline, the Andes Views P0 successfully launched on schedule on 3/30/23. This launch decreased time to release from ~6 hours to create and load a new Andes table to less than 5 minutes. Before, dataset owners would need to create and load an entirely new dataset from scratch to provide a subset of data to consumers, but with Andes Views they can quickly select a subset of rows and columns in minutes to create new dataset for consumption.
Outcomes
- Decreased time to release a dataset from ~6 hours to <5 minutes
- Andes Views are free with no data storage costs, as well as used behind the scenes for fine grained access control
- Dataset owners are primarily using Andes Views to restrict consumer access to their datasets, noting that they take “less than 3-5 minutes to get the view set up and send it to the customer.”
- Andes Views UI is a single page with 2 form fields and 1 query editor (4 clicks). In contrast, the existing Create Table flow has 11 form fields and 1 query editor across 4 pages (17 clicks). To create a Cradle profile and job to load the new dataset is an additional 15 form fields (18 clicks) and 18 form fields (32 clicks), respectively. This does not include the time it takes to actually run the load job, which can take hours depending on the size of the job
- In the first 4 weeks: 12.5min time on page (-58.9% from Create Table flow 30.4min), 1 workflow step (-75% from Create Table flow 4 steps), 19.6% task completion rate (109 views created / 557 page views), 33.4% step completion rate (109 views created / 326 “Create View” button clicks), 13.5% cancel rate (75 “Cancel” button clicks / 557 page views)
- To date, ~120k total views have been created with ~13k active views
- The code editor component was also prioritized for development in 2023 based on my designs and specifications to be implemented on the Andes Views UI and will be implemented in other DataCentral UIs such as the Create Table flow.
User quotes
“Overall, I love the experience! RLS [row level security] is a feature I have longed for over the past 2 years. The PartiQL UI is intuitive, the explain feature is very useful. This is going to help a lot of teams raise the bar for security of their datasets.” – Sr. Data Engineer
“I will give you guys kudos – views right out of the door it worked and it solved a use case immediately. It actually provided me some great value and reduced my time to release. I really appreciate this feature and functionality.” – Sr. Data Engineer
“How you define a view is very simple and straightforward. I don’t miss anything special for this UI. How this is designed is very simple and straightforward. That’s perfect.” – Business Intelligence Engineer
“[Andes Views saves] up to 6h for the initial table set up, plus timing to backfill different versions (16h/backfill) and run weekly jobs (2h/week). I cannot think of a valid alternative to views honestly with what exists right now which must be straightforward and simple to be understood by the majority of BIEs which doesn’t necessarily have DE skills.” – Business Intelligence Engineer
“Andes Views are going to be a game changer for the SDO data infrastructure. Going from an idea to a production launch in six months is great!” – BDT VP
Screenshot of developed UI