COVID-19 Dashboard
Category: UI / UX, Web Development
Role: Developer, UI/UX Designer (side project)
Year: 2020
Technology: HTML, CSS, JS/JQuery, Bootstrap, COVID19 API, Google Charts, Firebase
Update 10/10/2021: Open source COVID19 API is currently returning 0 for Recovered data
My take on the COVID-19 dashboard
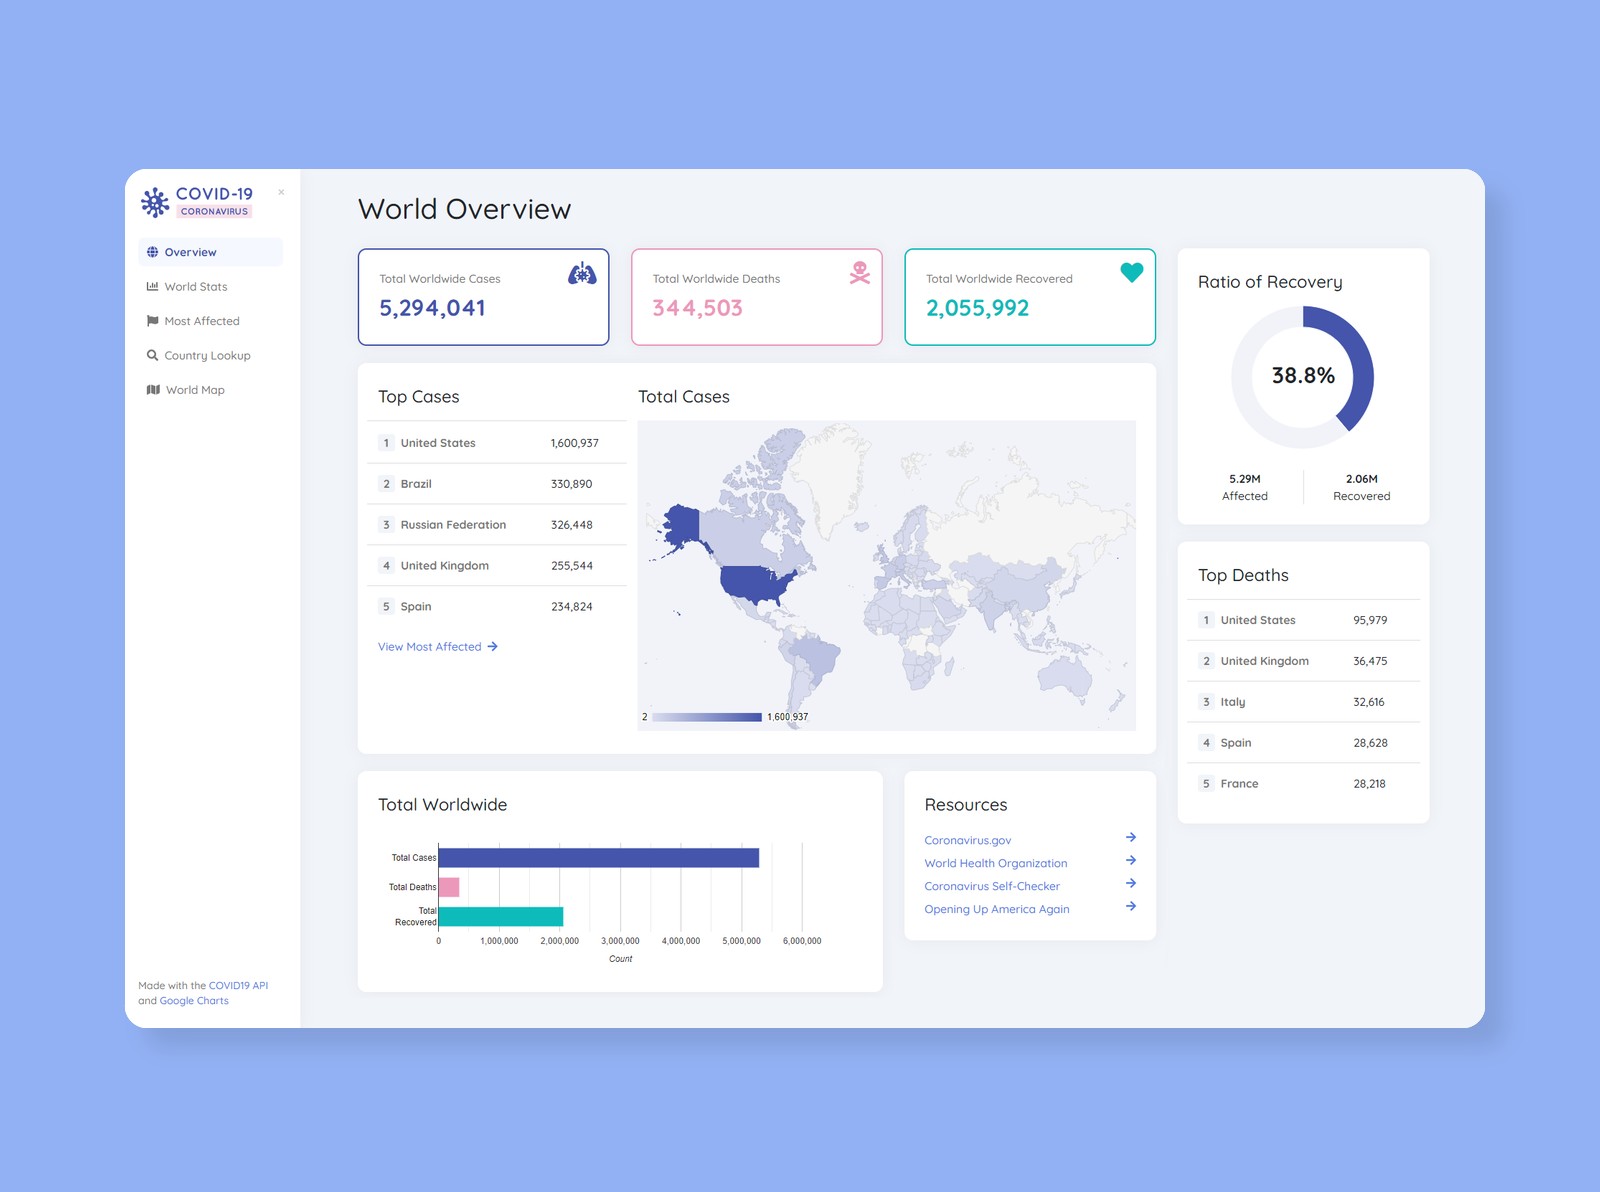
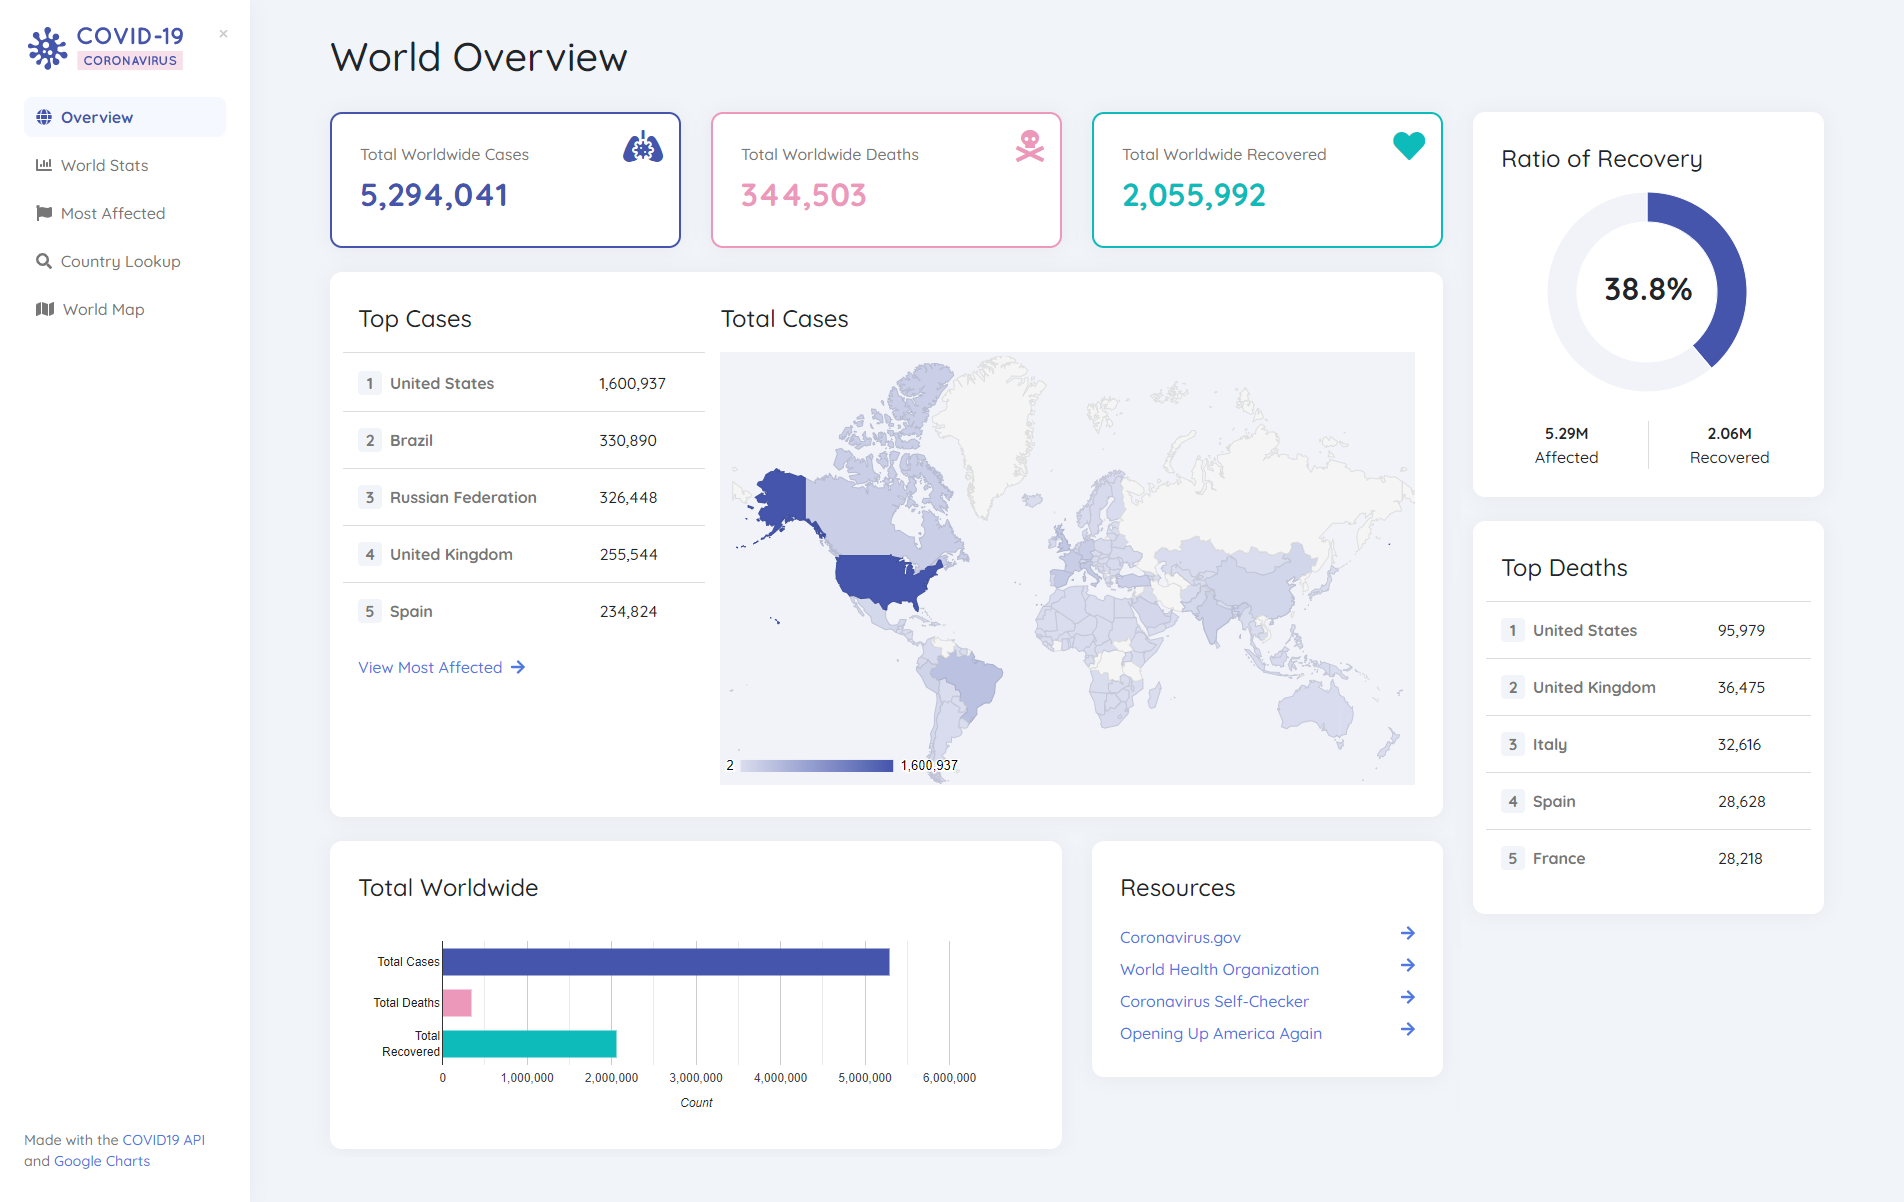
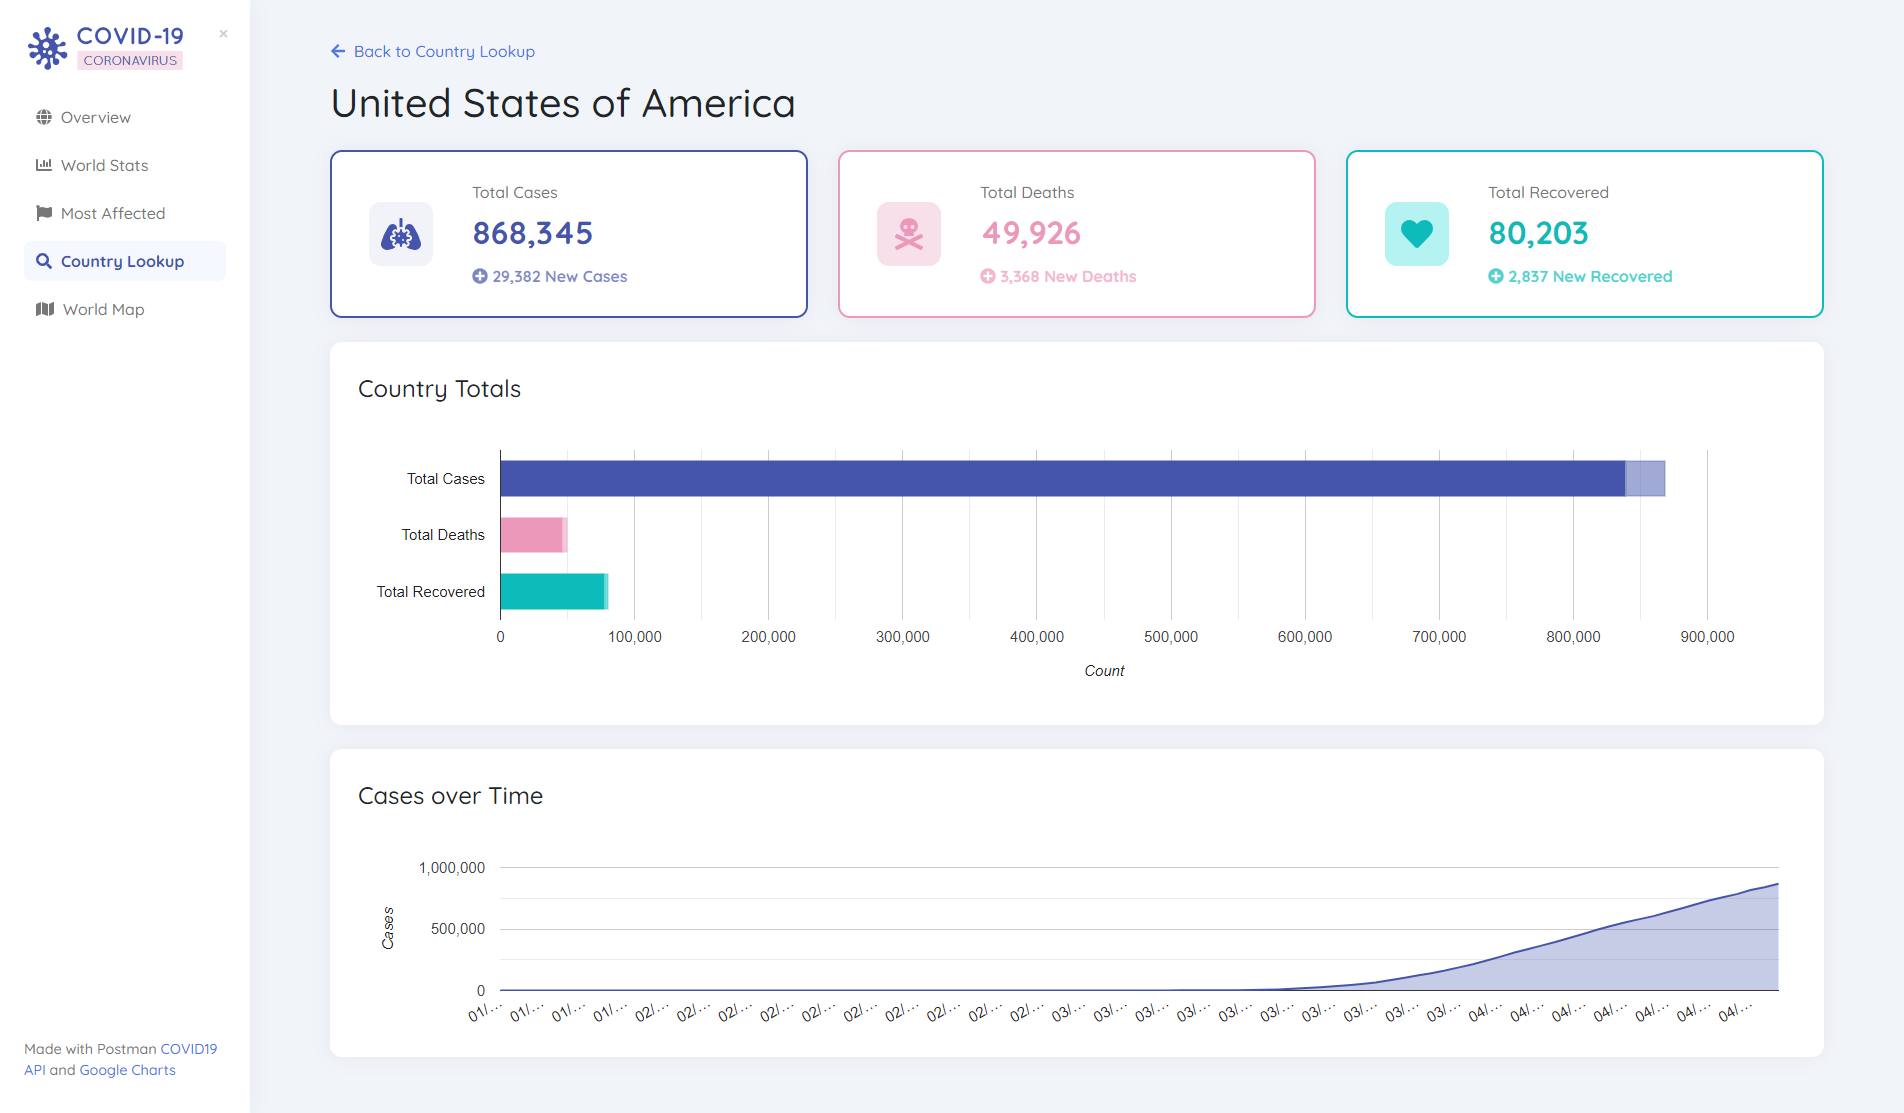
As a side project I designed and developed a COVID-19 Dashboard using the open source COVID19 API and Google Charts. There are a lot of Coronavirus dashboards out there, but I wanted to create a modern dashboard that displayed what I thought was the most important information in a clean, graphical manner. I then deployed the site using Firebase at covid-dashboards.web.app
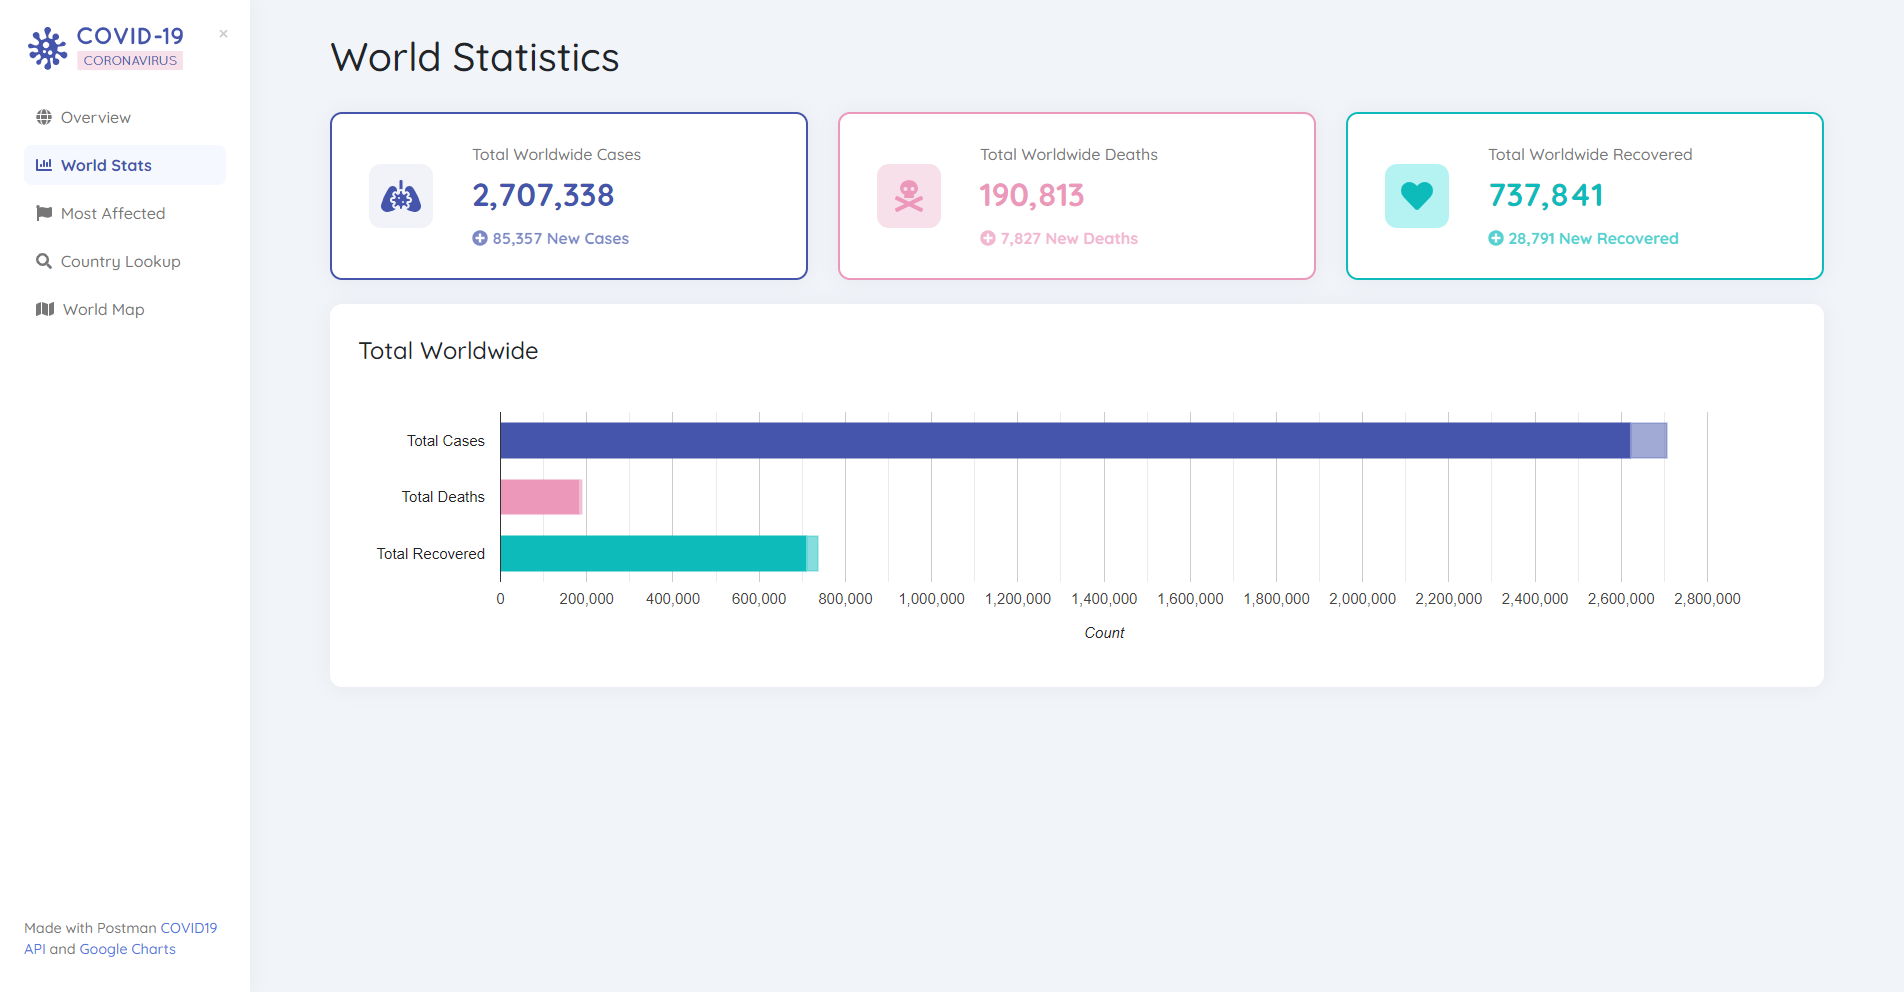
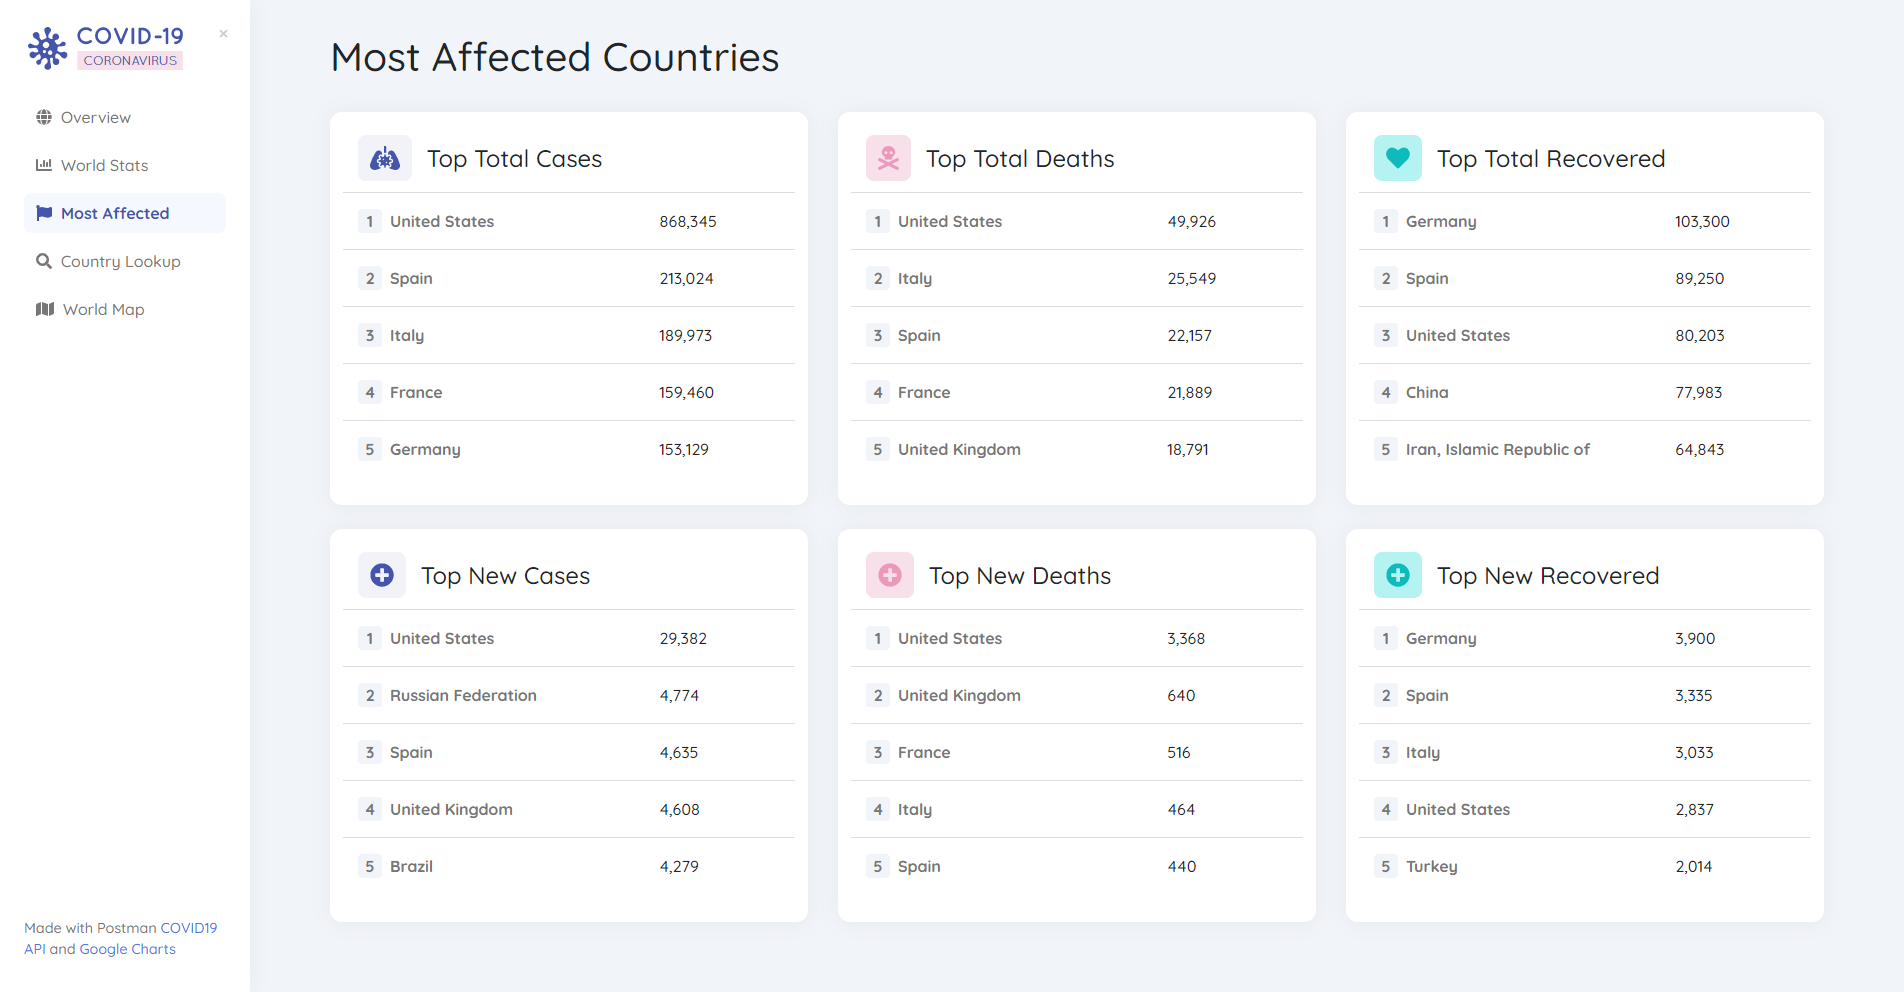
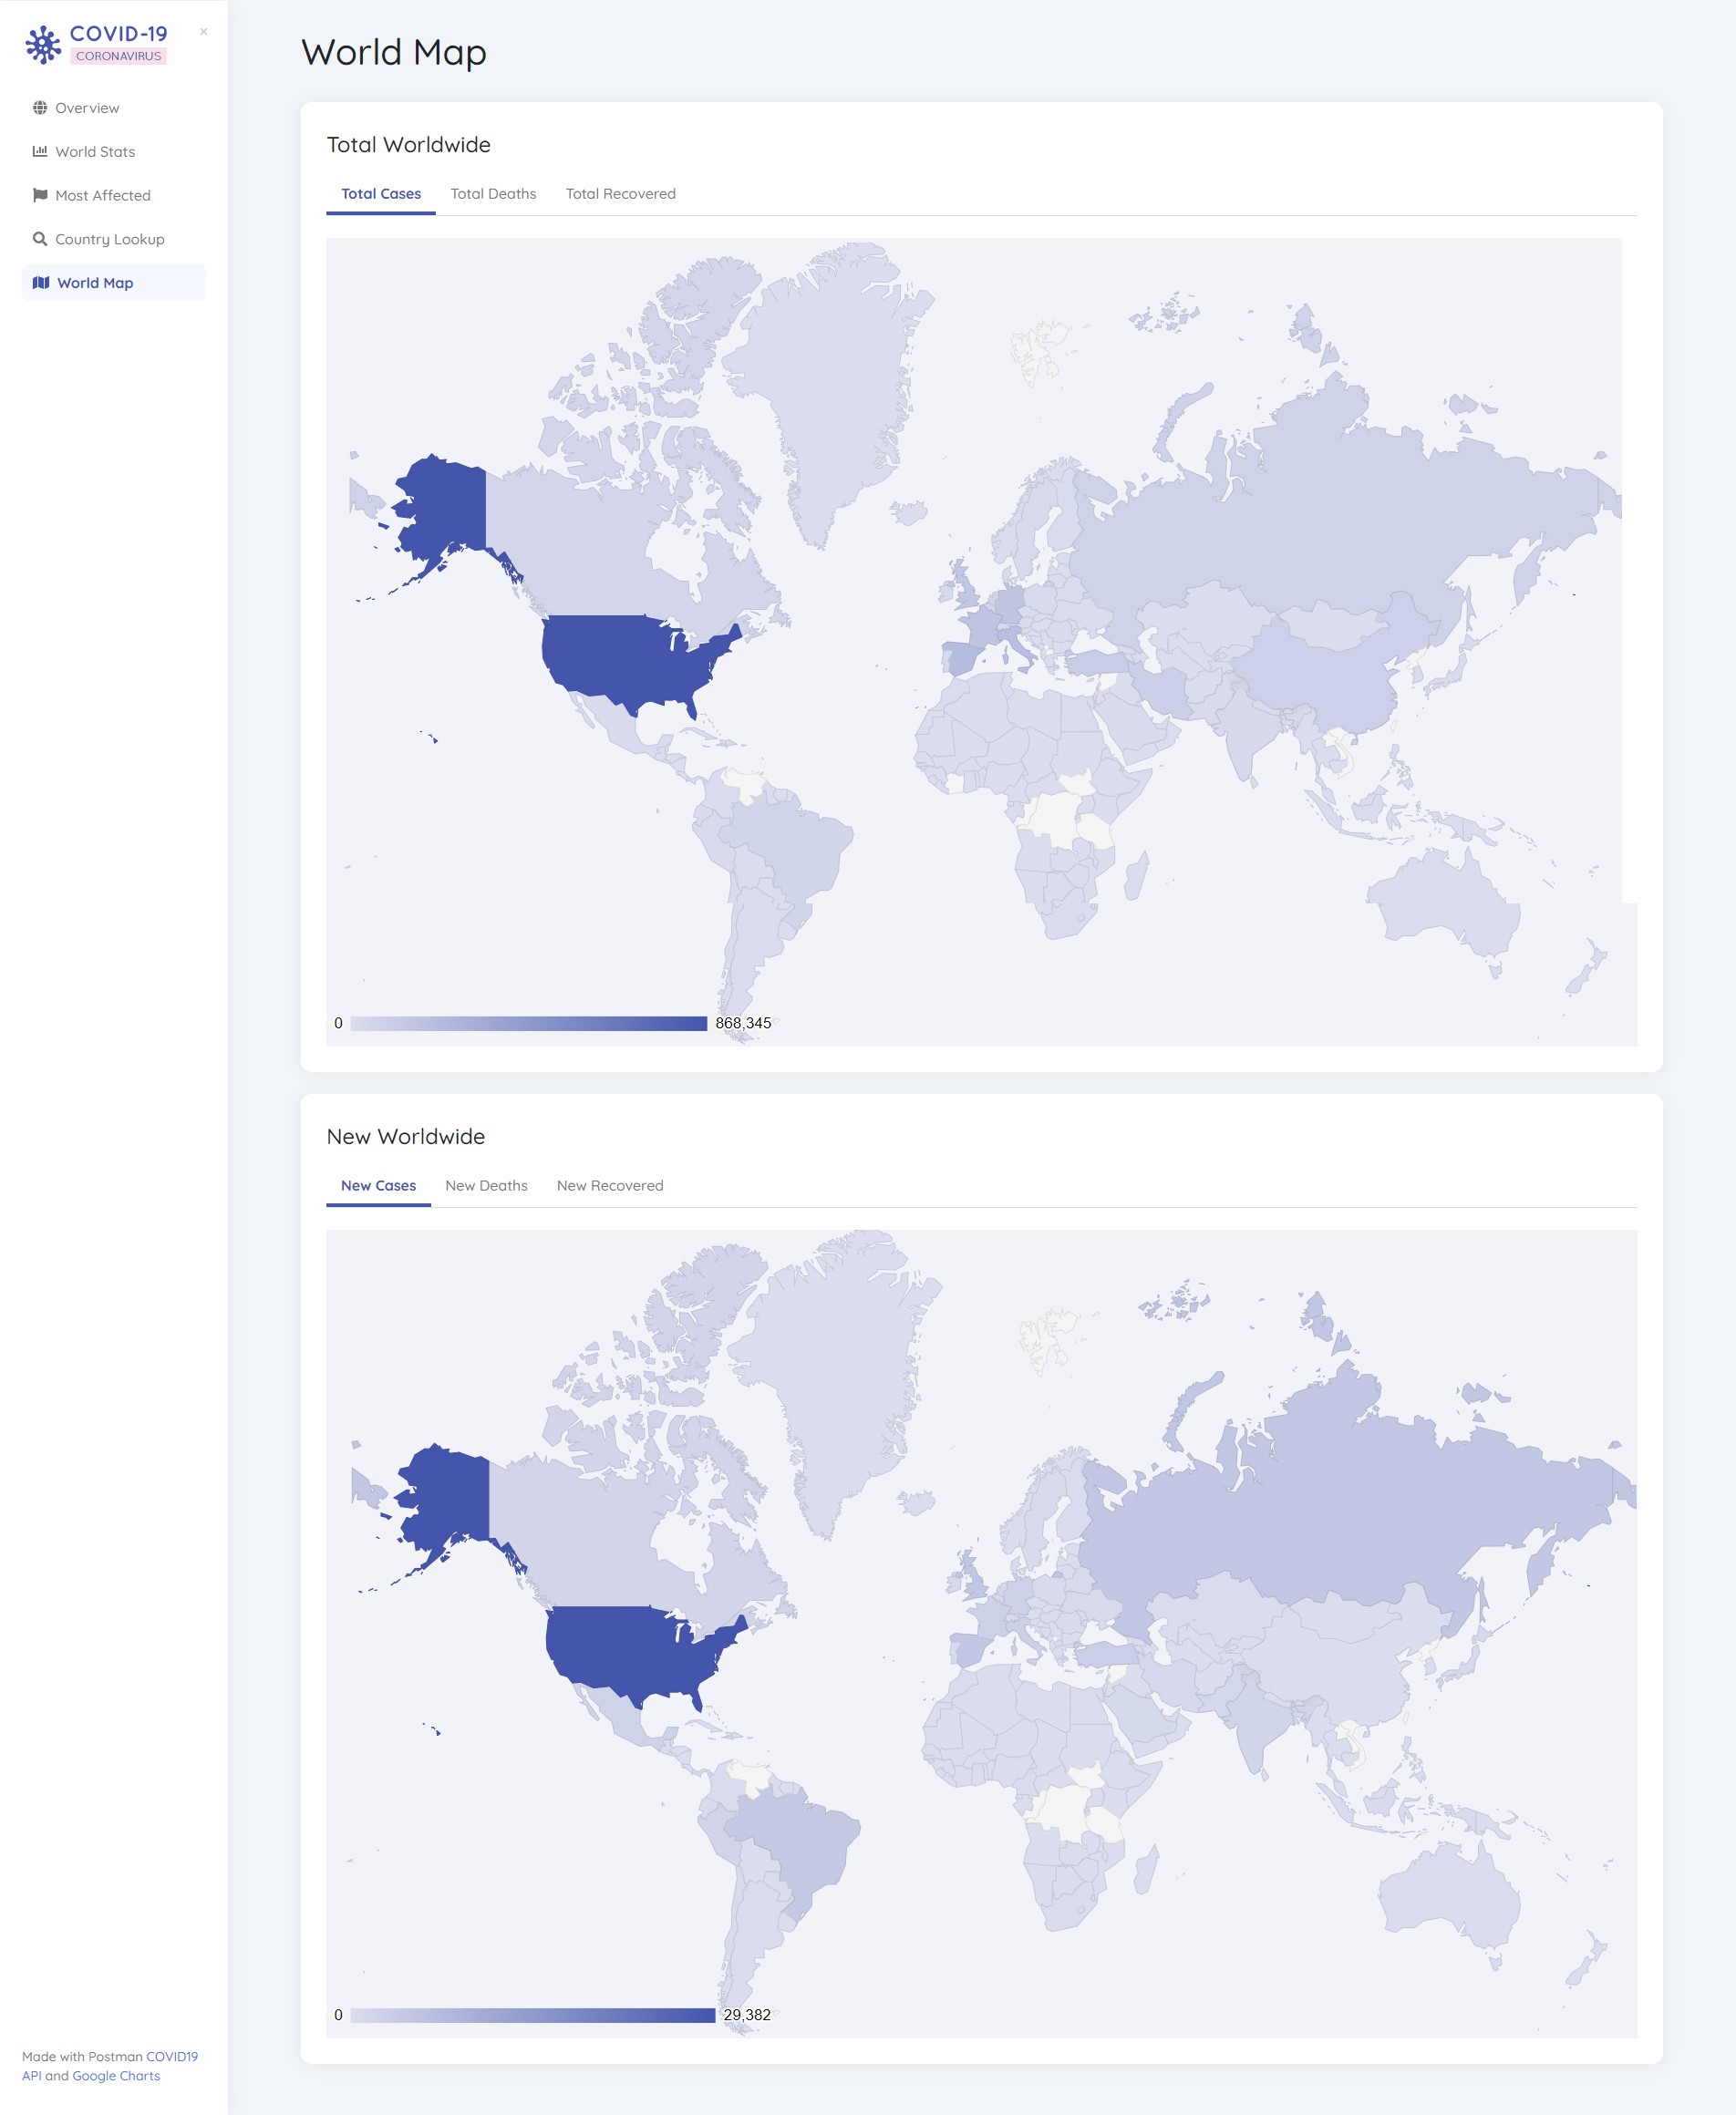
The dashboard contains a world overview with key data, high-level world statistics, “leader board” of most affected countries, a country lookup to search for a specific country, and a world map view to display the cases.